31 August 2009

Are equity markets due for a correction soon?

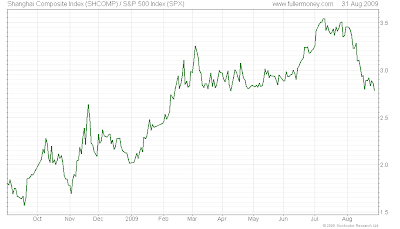
For 4 weeks, the Chinese Shanghai Composite Index has been down (-23.2% as of this morning). It was leading on the way up post September 2008 financial crisis, and one may wonder whether it is not showing the way down for other equity markets. All stock markets are well above their 200 days moving average, but the Chinese market that is less than 5% away. This dichotomy cannot carry on for long.

Let's see 2 graphs.

1) Shanghai composite/S&P 500: Whilst both markets peaked at the same time in October 2007, the S&P started to diverge during the first quarter of 2008, the Shanghai Composite having almost no pause in its downward spiral. It then bottomed early October 2008 to peak early July. The Shanghai index has clearly been leading the S&P for +/- 2 years.

2) Shanghai Composite / S&P 500 ratio: This an other way to look at the previous graph, but the ratio makes the comparison more striking. Since early July, the Shanghai composite is under-performing the S&P 500, under-perfomance that accelerated early August.

In the absence of really new good news, this leads me to expect the US market ( an other major markets) to be under pressure in the coming weeks. This pause would be most welcome in a secular bull market that I feel is intact since March 2009.

24 August 2009

Natural gas prices: something wrong?


Natural gas prices in the US have followed a downward spiral for a couple of month, and are now 4.5 times lower than in July 2008 at less than $3 / mmBtu (Henry Hub spot). This downward spiral accelerated since August 6, 1 month future prices losing 30%.

According to the EIA:
Factors on both sides of the market place have contributed to the price declines over the past several months. Recent reductions in natural gas price levels may be related to continued strength in domestic production capacity, specifically in unconventional gas fields [...]. Reduced demand as a result of the decline in economic activity is evident in the industrial sector, which accounts for more than 30 percent of yearly natural gas deliveries. The combined impact of these influences on the recent natural gas supply and demand balances has resulted in an inordinately high amount of natural gas in storage for this time of year.
Working gas in underground storage as of last Friday is estimated to have been 3,204 billion cubic feet (Bcf), which is 19.1 percent above the 5-year (2004-2008) average. During the week ending Friday, August 14, implied net injections of natural gas into underground storage totaled 52 Bcf.
In addition, the hurricane season did not bring any production/distribution disruption in the Gulf of Mexico so far which likely contributed to lower prices. However, peak storm season has only just begun, and a potential disruption to supplies cannot be discounted in the coming weeks.

Finally, August 24 the U.S. Natural Gas Fund, an exchange-traded fund held about 10% of the contracts in the October 2009 futures market traded on NYMEX. Combine that position with its over-the-counter swap holdings, and UNG held the equivalent of more than 50% of the October contract's open interest. In following its plan to buy and hold natural gas, UNG keeps rolling its position into the next futures month. In a bear natural gas market, UNG's massive monthly gas sell-off accelerates the fund's losses and brings down the price of natural gas with it.

UNG's equivalent position in the October futures contract amounts to over a trillion cu. ft. of gas. Given that the U.S. consumes an average of about 2 trillion cu. ft. of gas per month, UNG's position in the front month — at over half of that month's consumption — seems too large for a purely speculative fund.

This results in creating a great pricing inefficiency because this natural gas speculator is following a predefined plan — and the plan is publicly known.

Whilst the number of rig count was halved during the year, it did not offset the weak economy, good weather conditions, snappy production at both conventional and unconventional sources such as shale.
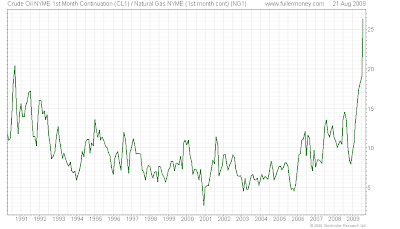
In the meantime, oil prices have continued to recover. Since the trough of the stock market on March 9, oil prices (WTI) have increased by over 50% whilst gas prices (Henry Hub) decreased by almost 30%. This has resulted in a oil/gas ratio reaching historical high. Technically the acceleration is impressive and cannot last. This ratio stand at 28, more than twice the historical average.

Gas prices are very volatile and there is no world market: it is a difficult instrument to trade where local circumstances can have large impact on prices. Whilst I cannot dismissed a total collapse of gas prices (particularly if there is not enough storage capacity and UNG's foolish strategy in futures market continues), my sense is that current prices are overshooting on the downside with the charts showing an acceleration that usually is an ending characteristic; but no key day reversal yet. Any recovery will bring substantial rewards. If you find storage capacity: buy spot and sell forward, there is a $2.2 spread between spot and December contracts.

Source:

Energy Information Administration
Natural Gas Weekly Update
http://tonto.eia.doe.gov/oog/info/ngw/ngupdate.asp

Time
As Oil Explodes, Why Natural Gas Prices Stay Low
http://www.time.com/time/business/article/0,8599,1918674,00.html

21 August 2009

Chart of the Day

The US stock market continues it resilience, which surprises me since I do not see any additional steam coming through: all good news are priced and bad news ignored; this cannot last for ever, whilst I am not denying that markets can diverge from reality for a long time. Risks of a larger correction are only increasing.

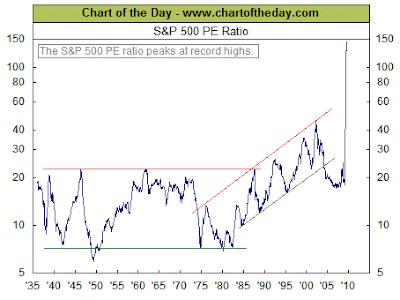
Today's chart illustrates how the recent plunge in earnings has impacted the current valuation of the stock market as measured by the price to earnings ratio (PE ratio). From 1936 into the late 1980s, the PE ratio tended to peak in the low 20s (red line) and trough somewhere around seven (green line). The price investors were willing to pay for a dollar of earnings increased during the dot-com boom (late 1990s) and the dot-com bust (early 2000s). As a result of the recent plunge in earnings and recent stock market rally, the PE ratio spiked and just peaked at 144 – a record high (Japanese style before the stock market crashed - I do not predict this, different time, different situation).

Currently, with 97% of US corporations having reported for Q2 2009, the PE ratio now stands at a lofty 129. At constant market prices, earnings have to be multiplied sixfold to go back to the historical average. Yes markets anticipate, but I doubt that 1) we will see earning recover by the magnitude withing 12-18 months and 2) that markets anticipate earning further away. Draw your own conclusions.

17 August 2009

"capitalisme étatique" / socialist capitalism

France Seeking Ban on Guaranteed Bonuses for Bankers
Sarkozy's Minister of Finance, Mrs Lagarde, strikes again! the question of guaranteed bonuses for banks' top performers should be discussed at the next G20 meeting
in September, as if the G20 did not discredit enough itself during the last meeting with its list of so called tax havens (remember the grey list where neither the Delaware, nor the Channel Islands nor China dominated Hong Kong and Macao were included, etc.). One farce is not enough, let's go for a second one.

Beyond what could be anecdotal (our politicians must not be busy to spend so much time on bonuses, whilst they should, at least, explain that performance must be rewarded - true, it would not bode well for themselves, just look at public deficits for the past 30-40 years...), it is very worrying that politicians are seizing the financial crisis (where they bear a huge responsibility - see previous post) to interfere more and more with the private sector. At least if they were managing economic affairs as well as the Chinese (don't misread me: I would not like to live under a Chinese inspired regime) one could discuss.

I am in broad agreement with Martin Spring's Newsletter:
If you think my recent comments have been over the top about how politicians and bankers have used the credit crisis to hijack the mega-billions of taxpayers’ money to promote their own interests, you should read what the Bank for International Settlements, the “central bankers’ club,” has to say in its latest annual report.

To recap, the essence of my criticisms of the way governments have been handling the crisis has been:

► Nearly all the effort, with its enormous expense, has been directed to containing the symptoms rather than addressing the cause -- bad debt. That’s like trying to cure cancer with doses of morphine instead of radical surgery.

► The money flood is largely being used to protect jobs and investments in a bloated banking system – it’s not flowing through to where it’s needed most, in the soundest companies in manufacturing and the other service industries.

► Even worse, the money is going to the least deserving – such as the big banks with the right political connections, with major responsibility for causing the crisis in the first place – putting at a competitive disadvantage their rivals, who were and are being managed responsibly.

► Banks, other financial intermediaries, and long-term investors such as pension funds, are all refusing to acknowledge the scale of their bad debt, write down so-called “assets” to their true value, and recapitalize and restructure accordingly.

► Stimulus packages are largely designed to favour political vested interests and ideological obsessions, rather than provide immediate and effective support for business survival and job creation. They are a huge waste of money – borrowed money that will have to be repaid by future generations.

Political management of the crisis is so obviously corrupt, self-serving and incompetent, that it is producing a voter backlash that will gather momentum and make it very difficult to implement future unpopular measures, no matter how necessary they may be. The politicians, their bankster friends and the bureaucrats have poisoned the well.

N.B. emphasis mine

Sources:


Bloomberg: France Seeking Ban on Guaranteed Bonuses for Bankers
http://www.bloomberg.com/apps/news?pid=20601087&sid=ah2OmuI9QqEA

BIS: An assessment of financial sector rescue programmes
http://www.bis.org/publ/bppdf/bispap48.pdf

BIS: Annual Report
http://www.bis.org/publ/arpdf/ar2009e.htm

Marin Spring: On Target Newsletter - Sept 2009 Issue

14 August 2009

Weakness in U.S. Retail Sales

U.S. Retail Sales Shows No Signs of an Uptick in Final Demand

Nominal retail sales fell 0.1% m/m (-8.3% y/y) to US$342.2 billion in July 2009 after rising 0.8% m/m in June. While motor vehicle and parts sales rose 2.4% m/m with a boost from the "cash for clunkers" program, ex-auto sales fell 0.6% m/m (-8.5% y/y). Gasoline station sales fell 2.5% m/m (-32.5% y/y) and core retail sales fell 0.2% m/m (-3.4% y/y). (U.S. Census Bureau)

Like in Europe, clothes and auto were mostly leading the positive numbers thanks to rebates at retailing outlets and help from the government for the auto sector. This is
not sustainable beyond the short term if genuine final demand is not back in September and Q4. We can have all the inventory building in the world but it can't last in the absence of a consumer pickup.

US equity markets ended the day up, beyond my understanding.

13 August 2009

"Une hirondelle ne fait pas le printemps"

So GDP in Europe contracted less than the consensus at 0.1% vs. 0.5% during Q2 2009? Germany and France showed positive numbers at +0.3% each? So, the recession is over?
  1. Economists have proven so many time that they are wrong, that my confidence in consensus numbers and forecasts is at an extremely low level. Numbers are better than the consensus, so what? It just shows that economists are bad at forecasting.
  2. As Barry Ritholtz recalls on his blog, The Big Picture, in 2001 Q2 was also positive whilst Q1 and Q3 were negative; a positive quarter does not imply the end of the recession: "Une hirondelle ne fait pas le printemps".
  3. French GDP +0.3%: yes. And according to Christine Lagarde, public sector investment had a strong impact, whilst exports contributed for 0.9% thanks to exports in the automotive sector to Germany and private sector investment for -1.8% (still very weak). Consumption stood at 0.3%, due to government trade-in schemes for old cars and falling prices, particularly among big retailers.
  4. German GDP +0.3% (see graph below) on exports and government help for new car purchases.


Is the financial crisis over? Yes (or at least most of it -watch however commercial real estate bad loans as well as credit card delinquencies for the coming quarters): OIS and TED spreads are back to normal, financing costs is next to zero, competition is slimmed down, bank profits are therefore up (even if profits from trading generally is volatile).

Is the economic recession abating? Yes, but we are still not out of the woods as yet, and claiming that the recession is over, is over the top. However, my sense is that we still are several months away, say 6-12 months. Don't forget: "Never fight the FED".

Markets are rallying on the news, after yesterday's drop. I am still of the view that a consolidation is overdue and that markets could loose anywhere between 10% and 15% until early Q4 2009 to start rallying again late Q4 for the next leg. Then watch commodities going through the roof in 2010-2011.

Sources:

Bloomberg: Euro-Area Economy Contracted 0.1% in Second Quarter
http://www.bloomberg.com/apps/news?pid=20601087&sid=aAL7VZFlPRow

XE: French Q2 GDP rises 0.3 percent-minister
http://www.xe.com/news/2009-08-13%2002:54:00.0/609921.htm?c=1&t=

Eurostat: Newsrelease
http://epp.eurostat.ec.europa.eu/cache/ITY_PUBLIC/2-13082009-AP/EN/2-13082009-AP-EN.PDF

Finfacts: Business News Centre
http://www.finfacts.ie/irishfinancenews/article_1017398.shtml

11 August 2009

The magnificent 7 and equity markets - Review 3

After a brief pause in June, equity marked have forged ahead again. Let's review what the magnificent 7 are telling us (I recommend the reader to go to the GTI web site for their monthly newsletter, one of the best available). Today, I propose weekly charts to provide some historical perspective, the short term panic level being history now.

S&P 500 Banks index: after a 2 months consolidation between early May and early July, the sector caught back the retracement and passed the May peak. The index is now trading over the 200 days moving average and getting a bit overextended short term. This was helped by good quarterly results from a number of US banks, even if they were mainly driven by trading profits. The 100 mark held very well, and we are now establsihing a new support at 128-130. Positive.

Global 1200 financial index: The world financial sector is showing an even better move than the US, being above the early November peak and well above the May and June peak. The index looks more over-extended than the S&P 500 Bank index, standing well above its 200 days moving average; the latter is however turning higher, technically favourable. Positive.

TED spread (LIBOR USD 3 mth - US 3 mth T-bills): The spread is now back to historical average, even slighly below. Positive.

USD bank BBB 10 yr - US 10 yr yield: Whilst still elevated, the 7% level is now broken and the spread consistently heads south. Slightly positive.

OEX volatility: OEX volatility has markedely decreased, back to the summer 2007 when financial troubles appeared first on markets. The moving average is also going south, a positive indicator. Positive.


S&P Case Shiller house price index
(source: S&P): The latest data (June) published in July show the 4th consecutive month of yoy decrease in the rate of decline. More importantly, the index increased for the first time since June 2006 (151.00 in May for the Composite 10 vs. 150.38 and 139.84 for the composite 20 vs. 139.21 - not seasonnally adjusted). Signs are becoming more encouraging. Neutral.

Oil price: After a short consolidation down to $60/b, oil prices reached $74/b again where some resistance seems to appear. The $60-74 trading range should hold for some time. However, when it breaks uptwards, it will rally very sharply. Positive for the time being.

Conclusion: In our last review (July 10), we advise to take profits off the table. Fundamentals in the interbanking market have back to more or less normal levels, economic indicators are getting better, despite a few clouds still hovering around. Equity markets are now pricing a hefty recovery next year ( in the US +4% GDP growth and + 40% earnings growth), which is too agressive at this point. As advised in my previous post: relax, enjoy the summer, take time for the next action. I would add: be alert and prepare for the next move.

09 August 2009

Chart of the Day


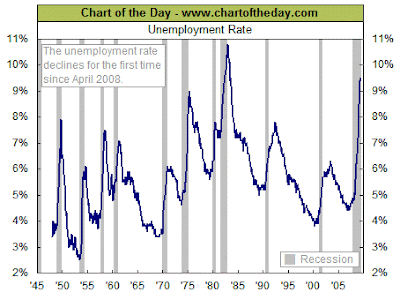
For some perspective on the current state of the labor market, today's chart illustrates the unemployment rate since 1948. Despite this month's encouraging decline, there was only one general period in the post-World War II era during which the unemployment rate was higher than the current rate of 9.4% (i.e. June 1982 - June 1983). It is worth noting, however, that a one-month decline in the unemployment rate (even a small decline) after a significant spike (i.e. the unemployment rate spikes by 1.5 percentage points or more) has tended to occur slightly after a recession had ended.

07 August 2009

The beginning of the end: economy getting better?

The recent stream of data coming out of the US a priori points towards a compelling economic improvement:
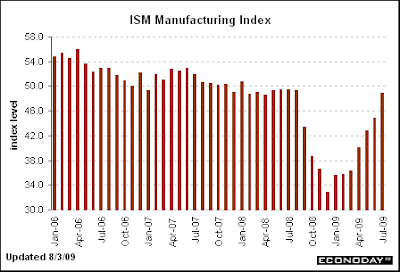
  • July's ISM manufacturing index jumped a very big 4.1 points to 48.9, much better than the consensus at 46.5, pointing to a 50 reading for the August report which would mark the bottom of the manufacturing recession in the US (trough in December 2008).
  • The pending home sales index for June jumped 3.6 percent, the fifth in a row for the best streak in six years. In a further boost, May was revised higher to 91.3 vs. an initial reading of 90.7. Year-on-year rates confirm the improvement, up 6.7 percent in June. It has been a long dreary run but the residential housing sector has hit bottom and appears to be turning higher, confirmed by the Case-Shiller index published last week.
  • Today's job losses came in much lower than expected at 247,000 vs. the consensus forecast for 300,000 decrease, and point to being at or near the end of recession. And the unemployment rate surprisingly edged down to 9.4% from 9.5%. June and May revisions were up a net 43,000. The easing in job losses was seen in both goods-producing and service-providing sectors. The latest numbers brought total jobs lost since the recession began in December 2007 to about 6.7 million, the biggest decline in any post-World War II economic slump.
Despite this better economic background numerous clouds are still hovering around: slow personal consumption, high unemployment, commercial real estate refinancing in the two coming years, etc.

Equity markets have however rebounded in a very strong fashion since the March low, and the June consolidation was short lived: I still believe that it is time to relax and enjoy the holiday period; market must correct in order not to become too overextended, already pricing a strong return to economic growth (the S&P 500 is now pricing a 40% earnings growth and 4.0% real GDP in the coming year as calculated by David Rosenberg of Gluskin Sheff & Associates).

03 August 2009

Chart of the Day


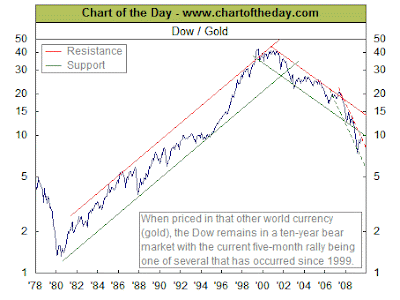
Today's chart presents the Dow divided by the price of one ounce of gold: it currently takes 9.8 ounces of gold to “buy the Dow.” This is considerably less that the 44.8 ounces it took back in 1999. When priced in gold, the US stock market has been in a bear market for the entire 21st century and is currently trading 78% off its 1999 highs. The recent five-month rally, however, has the Dow (priced in gold) putting in a significant test of resistance of an accelerated downtrend that began in mid-2007.

Note that in 1980, the ratio was approximately 1.5, i.e. +/- 6 times less than today.