Showing posts with label US economy. Show all posts

20 November 2012

Why the US economy will substantially outperform the EU for the long run


I do not intend to be comprehensive with tons of indicators which are available: I will only focus on a few which, in my opinion, are making THE difference.
1. The banking sector
Whilst US banks have largely cleaned up their balance sheet, or more exactly dramatically reduce their leverage to around 15 x, and have been able to return to markets to fund themselves at market price (the FED has withdrawn its unconventional liquidity measures), the European banking system remains under life support from the ECB in the turn of EUR1 trillion Long-Term Refinancing Operations. The European banking system has a funding gap of EUR 1.3 billion, and as the WSJ writes “… if European banks were funded the same way as U.S. banks, they would have a deposit surplus of $3 trillion”.
This is why the US banks are lending t the US economy and European banks do not finance the EU economy whilst remaining too leveraged at 30 x. To worsen the situation, banks are increasingly hoarding money with the ECB: USD1.4 trillion as of 9 November.
2. Lending to the economy

The US commercial and industrial loans from all commercial banks is an indicator I follow on a regular basis and it proved to be a good early indicator of the US economy turnaround. Velocity is however part of the money creation and has dramatically fallen since the beginning of the financial crisis.
Today, I am adding velocity to present a more precise picture. Interesting enough velocity of MZM(1) * commercial & industrial loans by all commercial banks turned up +/- 1 year ago, adding a bullishness view on the US economy, despite the fact that MZM velocity is at 1.4 x, the lowest since 1959 (when it started to be reported). Banks are financing the US economy.


(1) MZM = M2 less small-denomination time deposits plus institutional money funds. Money Zero Maturity

3. Energy
One point largely occulted by commentators regarding the US fiscal and trade deficits is the energy sector. If the US, and everything seem pointing in this direction, becomes self sufficient within 10 years, this will be huge boost to the trade balance and therefore the GDP growth.
The oil & gas 2011 trade deficit stood at $993 bn for a GDP 15,321 bn or a negative growth of 6.5%; if one assumes that thanks to unconventional oil & gas the US can reduce its energy trade deficit by 50% this would add 3% to GDP: this is a game changer and the fiscal cliff would be much easier to climb.
The unconventional gas industry will have far reaching effects including job creation and re-industrialization. According to HIS, “the shale gas production supported 600,000 jobs in 2010, a number that is projected to grow to nearly 870,000 by 2015”.

PWC mentions in a 2011 report that by 2025 shale gas will save US manufacturers USD11.6 billion a year in gas expenses and add 1 million workers.
Hence my positive stance on the US economy.
What will enhance competitiveness of the US industry will have the reverse effect in Europe which largely ignores shale gas on the ground of ecological worries. This will represent a competitive disadvantage to Europe not only in term of price but also independence, since Europe largely relies on non-EU supplies.
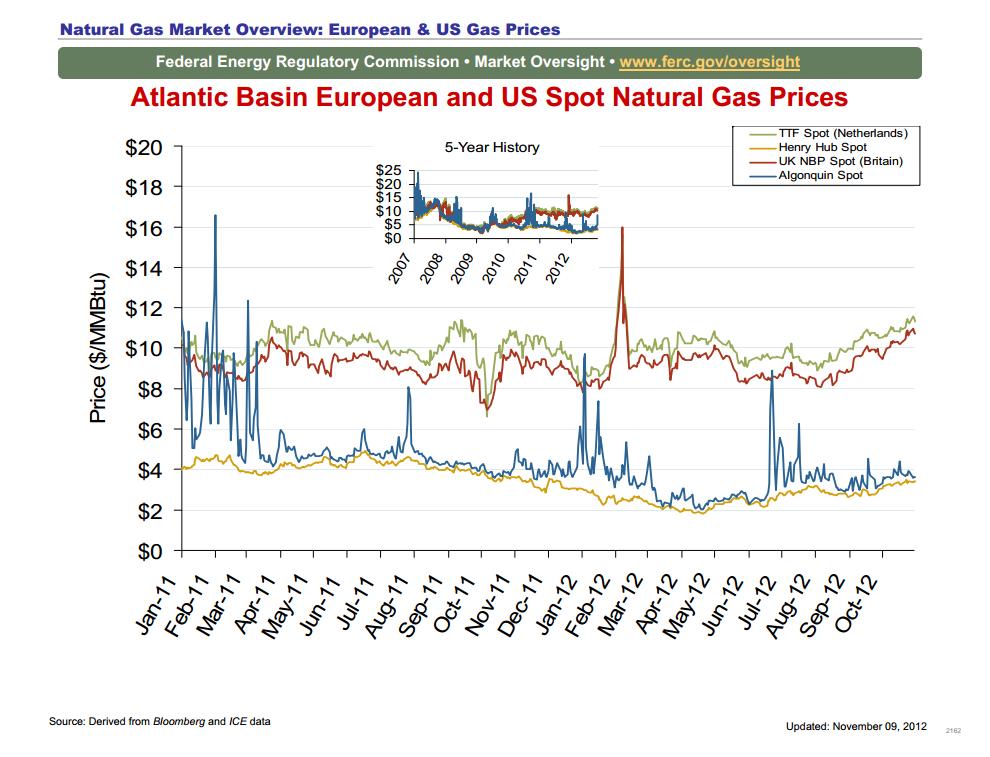
When enlarging the picture, the map shows that the US competitive advantage goes well beyond Europe: other countries are paying 3 to 4 times the US price.
Finally, the competition between energy sources had a direct impact on crude oil in the US. The gap between the Brent and WTI started to widen two years ago to reach a 20% price advantage today, not petty money.

Source:

Federal Reserve Bank of St Louis: Economic Research
http://research.stlouisfed.org/
Federal Energy Regulatory Commission: Natural Gas Markets
http://www.ferc.gov/market-oversight/mkt-gas/overview.asp
Wall Street Journal: Why Europe’s Banks Trail in Deleveraging Process
http://online.wsj.com/article/SB10001424052702303816504577303582094739676.html
Live Wall Street Journal: European Banks Still Hoarding Money
http://live.wsj.com/video/european-banks-still-hoarding-money/798ED78D-6CA2-442D-A41B-54FA9CB860A9.html?mod=wsj_article_tboleft#!798ED78D-6CA2-442D-A41B-54FA9CB860A9
Penn State University: The Economic Impacts of the Pennsylvania Marcellus Shale Natural Gas Play: An Update
http://www.anga.us/media/41077/penn%20state%20marcellus%20study.pdf
HIS: The Economic and Employment Contributions of hale Gas in the US
http://www.ihs.com/images/Shale_Gas_Economic_Impact_mar2012.pdf
PWC: Shale Gs – A renaissance in US manufacturing?
http://www.pwc.com/en_US/us/industrial-products/assets/pwc-shale-gas-us-manufacturing-renaissance.pdf

31 July 2011

US deficit and debt ceiling

An interesting chart showing payments to be made by the US Government after Tuesday 2 August deadline when the debt ceiling will be reached and the US no longer able to borrow: on July 28th the US debt stood at USD 14,293.275 billion extremely close to the statutory limit of USD 14,294 billion.
The Bipartisan Policy Center calculated that August 10 is the date when the US will run out of cash and not August 2. Anyway the day of reckoning is getting really close…
It is worth noting that the debt ceiling has been increased 78 times since 1960, or 47 times the USD 300 billion record reached during WWII.
If a bipartisan deal is reached by then, expect the USD to rally and precious metals to fall.


Source:
http://www.bipartisanpolicy.org/sites/default/files/Debt%20Ceiling%20Analysis%20FINAL%20%28updated%29.pdf
http://www.nytimes.com/interactive/2011/07/28/us/charting-the-american-debt-crisis.html?ref=politics

09 February 2011

US economy outlook

I follow US tax receipts which give a rather accurate picture of the state of the real economy. Whilst tax receipts from individuals have turned around in November 2009, they started to be positive in May 2010 and have substantially increased for the sixth month in a row to January 2011.


On the corporate front, the turnaround was in September 2009 and numbers became positive in February 2010.


All-in-all, tax receipts increased USD 44 billion in FY 2010 (end September) compared to FY 2009, the latter collapsing USD 248 billion with respect to FY 2008. For the first four months of FY 2011, tax receipts are USD 50 billion higher than in 2010, over 90% of this improvement coming form individuals.
These tax receipts are matching the (slow) improvement in the US unemployment situation: the US added 1 million jobs over 12 months and all indicators were better in January 2011 compared to January 2010 (duration of unemployment, part-time workers for economic reasons and no change for discouraged workers). The unemployment rate is down to 9%.
This tells me that consumers are better off and this is translating into other economic data like retails sales; the yoy rate of change is back to historic levels.
Total credit available to consumers has also turned around.
 If one analyses US Inc. accounts, I would draw three conclusions:
  • Cash flows are improving and even accelerating
  • The balance sheet is still plundered with toxic assets
  • Off-balance sheet is rather awful (non-funded future liabilities)
We are not out-the-woods as yet, but trees’ density is reducing.

Source:
Federal Reserve Bank of St. Louis - Economic Research
http://www.research.stlouisfed.org/
US Department of the Treasury – Daily Treasury Statement
http://www.fms.treas.gov/dts/index.html

08 December 2010

Tracking the Global Economy: United States

The latest release by the FED of St Louis confirms that the economic situation of the US continues to (slowly) improve.

Source:
Federal Reserve Bank of St Louis: Economic Research
http://research.stlouisfed.org/economy/us/gdpdata.html

21 October 2010

The US economy: no double dip! Long equities

Whilst the double-dip theory is waning these days, I thought it would be good to review a few economic indicators that cry that no double-dip is to be expected (but for economic/monetary mistake or exogenous shock).
First, the output gap turned around and whilst still negative is not pointing to a downward tipping point. The graph below clearly shows that employment is lagging the output gap indicator. In addition unemployment peaked four months after the recession ended, which is rather short compared to 1991 and 2001 recessions where the numbers were 15 and 19 months respectively vs. 1 month for 1981 recession: it seems that the deeper the recession the shorter the recovery time (that does not say anything about the magnitude of the improvement and unemployment is still very high by US standards).
Second, retail sales have also strongly rebounded and continue to forge ahead. We are back to April 2007 and September 2008 levels.

Third, despite a high unemployment rate, individuals have largely repaired their balance sheet to levels not seen since 2000 and the 1985-1990 period. I am convinced that the debt service payment/disposable personal income ratio will shrink further however that will weigh on GDP growth but make the economy much sounder longer term. In the meantime, the savings rate has stabilized in the 6% area.

Finally, we also analyzed US federal tax receipts from the 2006 tax year (ending in September) which present an online view of the real state of the US economy, since data are provided each week. The graph below plots monthly taxes received from individuals, corporations, excise and all contributors compared to the previous year.

Data clearly point towards an improving economy since February-April 2009; this corresponds to the trough of equity markets in the Western world in March 2009. The dramatic improvement in corporation taxes paid (+20% for the 2010 tax year) show that the economy definitely turned around whilst taxes paid by individual are still sluggish but have gained traction for a year now.
Excise taxes are as close as we can get for the exact picture of the economy: they improved a lot late last year and are now in a consolidation phase but nowhere near a double dip. It is worth noting the correlation between tipping point of the excise tax collection amelioration with the stock market trough in March 2009 and the sluggishness of 2010.
All the above lead me to think me that equity markets should at worse do alright at least to the end of the year.
Source:
US Treasury: Financial Management Service
http://www.fms.treas.gov/dts/index.html
Federal Reserve Bank of St. Louis: Economic Research
http://www.research.stlouisfed.org/fred2/

31 August 2010

Summary US economic indicators

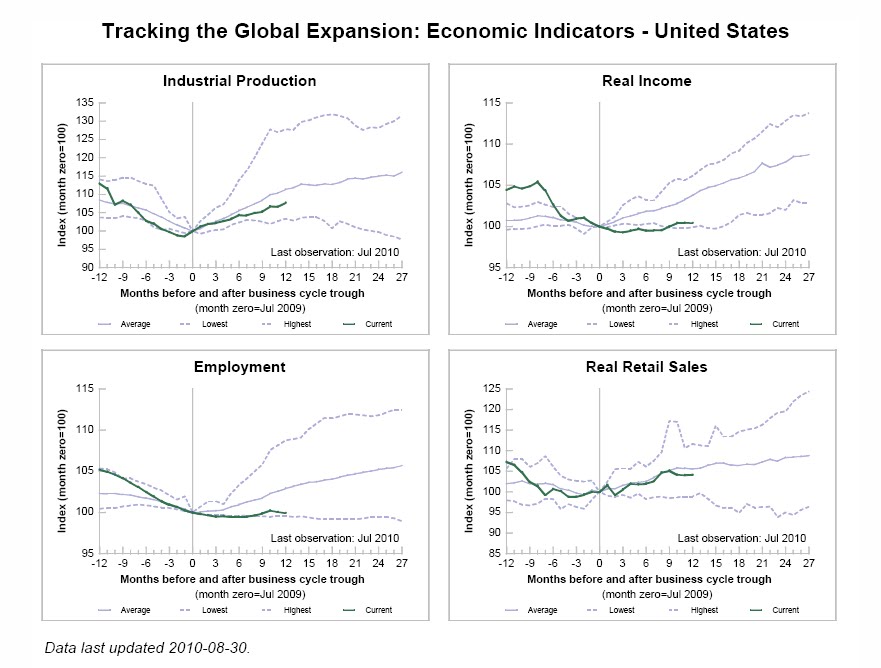
I found the tables below good summaries of US economic indicators.
As well publicized, including in this blog, the weakest point is the employment situation and consumption its corollary; for the rest the situation is not as disastrous as often related in medias, in particular on the investment front. All these graphs and indicators are posted without any further comment.


Source:

Federal Reserve Bank of St. Louis: Tracking the Global Economy - United States

http://research.stlouisfed.org/economy/us/index.html

U.S. Department of the Treasury: Economic Statistics - Quarterly Data Update

http://service.govdelivery.com/service/view.html?code=USTREAS_6

23 March 2010

Economy and equity markets: are they disconnected?

saSince July 2009 I have been ambivalent with equity markets after their strong recovery from March low and continued weak economic data. The magnificent 7 indicators are all favorable and therefore tell us that there is nothing to panic about equity markets. But is this disconnected from the economic reality? So, let’s review a number of economic indicators. More than the numbers themselves, I will be looking at trends. In this analysis, I will neither review the situation of the financial sector nor the housing sector.
1. GDP breakdown
The second estimate of the fourth-quarter increase in real GDP is 0.2% higher than the advance estimate at 5.9% annualized, primarily reflected upward revisions to private inventory investment, exports and nonresidential fixed investment that were partly offset by an upward revision to imports and downward revisions to personal consumption expenditures and to state and local government spending.
The trend is definitely improving. The next 2 quarters will tell us whether we may get into a second dip recession. Today, I tend to give the GDP the benefit of the doubt.
The Conference Board Leading Economic Index increased 0.1% in February (+0.3% in January and +1.2% in December) pointing to a slow recovery, but a recovery nonetheless.
Ken Goldstein, Economist at The Conference Board: "The indicators point to a slow recovery this summer. Going forward, the big question remains the strength of demand. Without increased consumer demand, job growth will likely be minimal over the next few months."
2. Consumption
Personal disposable income has grown for 5 month in a row until it decreased in January due to an increase in federal non-withheld income taxes according to the Bureau of Economic Analysis. At the same time, the personal consumption expenditures went up for the 9th consecutive month in January (+ $52.4 billion). The personal saving rate decreased to 3.3% from 4.2% in December, but is now in solid favorable territory, even if I would like to eventually see it in the 7-8% region.
The trend is positive. In my opinion, pay checks given by the Bush and Obama administrations were used to repair households’ balance sheets during H1 2009, and now we are witnessing a non-subsidized consumption growth.
Household debt service payments and household financial obligations as a percent of disposable personal income have also decreased from 13.92% and 18.87% in Q1 2008 to 12.60% and 17.51% in Q4 2009 respectively.
All this translated into an improving picture for retail sales.
3. Unemployment
Unemployment seems to have stabilized with an unemployment rate of 9.7% in February and 14.9 million unemployed; the number increases to 16.2% and 24.9 million unemployed if we add part-time workers for economic reasons and discouraged workers, but slightly off the high reached a coupe of months ago. However, the number of discouraged workers continues to increase unabated to 1.2 million people (+65% compared to February 2009 and + 13% compared to January 2010) .
The employment situation, according to the establishment data, confirms this stabilization. Total non-farm employment went down 36,000 in February vs. -26,000 in January, -726,000 in February 2009 and -109,000 in December. Weekly hours worked also point toward a stabilization.
The diffusion index for the total private sector dramatically improved to 48.0 in February vs. 44.2 in January, 39.6 in December and 17.1 in February 2009 (50 percent indicates an equal balance between industries with increasing and decreasing employment). The diffusion index for manufacturing jumped to 54.9 in February vs. 40.9 a month earlier.

4. Banks’ lending
In February, banks continued to shrink commercial loans for the 16th month in a row, shedding an additional $17 billion; total commercial loans outstanding are back to the summer 2007 and $345 billion below the peak reached in October 2008 ($1,645.6 billion).
Whilst this is negative for growth as a whole since less credit is available, I take it as a favorable element in what was an economy built on over-indebtedness steroids, particularly at the household level, and the system has to be purged.

In addition, the rate of decline seems to be arriving at or near a trough.
5. Net export of goods and services
The balance of net export of goods and services dramatically improved, whilst higher again for the last two quarters, to represent a $449 billion deficit. This suggests that the US trade deficit will have a long way to really get any closer to being balance.
As soon as the economy will improve on a sustainable basis, energy and commodities prices will forge ahead and will add more weigh on the US trade balance. Any oil alternative like gas or shale gas, will take some time to gap the national output/consumption imbalance, but worth watching since it could change the ball game.
Conclusion
Equity markets have anticipated the economic recovery which is in its infancy. The important indicators are at worse stabilizing. Markets paused in July and again in January/February to go back to their previous high and extend to new post crisis highs.
As of today, market patterns are justified by economic data. However, on a simple valuation based on Shiller’s cyclically adjusted PER, the S&P 500 is becoming expensive at 21.3 x earnings on March 18 vs. 13.3 x in April 2009 and an average of 16.4 x. On a simple PER basis, the S&P 500 is trading at the top of its mid 30s - mid 90s range but well below its mid 90s – 2008 exuberance.
I conclude that equity markets are not disconnected from the real economy and there no reason, under the current circumstances, to fear a market collapse. The S&P is however no longer cheap and, despite a good earning season, I would continue to selectively buy on weakness quality stocks having displayed their ability to pay dividends. I would favor energy (oil in particular), technology and consumer companies with worldwide brands (P&G, Nestlé, Unilever, J&J for example) as well as “progressing” markets (terminology that I prefer to emerging) and stay wary of bank’s stock at least in the "regressing" world (i.e. developed).
Monetary policy will remain accommodative until the real estate market has fully recovered and don't forget, “never fight the FED”. As my friend, Jacques-Henri Gaulard, Managing Partner of Autonomous Research – a top notch independent research firm specializing on the financial sector -, says about interest rates : "we have moved from L4L to L4E – Low for Longer to Low for Ever…"

Sources:

Bureau of Economic Analysis: National Economic Accounts
http://www.bea.gov/newsreleases/national/gdp/2010/txt/gdp4q09_2nd.txt

The Conference Board: Global Business Cycle Indicators
http://www.conference-board.org/pdf_free/economics/bci/birdairc2.pdf

Bureau of Labor Statistics: Employment Situation
http://www.bls.gov/news.release/empsit.toc.htm

Federal Reserve Bank of St Louis: Economic Research
http://www.research.stlouisfed.org/

Yale Department of Economics: Robert Shiller Online data
http://www.econ.yale.edu/~shiller/data.htm
FullerMoney: S&P 500 Graph
http://www.fullermoney.com

Markets & Beyond: The Magnificent 7 and Equity Markets
http://marketsandbeyond.blogspot.com/2010/03/magnificient-7-and-equity-markets.html
Autonomous Research
http://www.autonomous-research.com/x/default.html

19 February 2010

FED quantitative easing exit: has it started?

The FED 0.25% discount rate hike yesterday evening came as a surprise. Banks are now borrowing at 0.75% instead of 0.5%, not a big deal: there is still plenty of space for banks to play the yield curve.

Two days ago I wrote that I did not see a hike in interest rates any time soon, so this move is a surprise regarding the timing. First, its significance is rather minor since it is applied to emergency funds provided by the FED to financial institutions. The fed funds (0.25%) are the ones that really matter since they impact borrowing costs for companies and consumers (mortgage in particular) and the FED indicated that an increase in the discount rate did not imply an increase in FED fund in the future. Second, I view this increase as is a signal sent to the market psyche about the FED seriousness in preparing the QE exit, controlling future inflation and therefore tame investors' future inflation expectation to keep rate in check (don't forget that the US a has a huge debt to finance).
True, the Fed had been warning for some time that this was going to be part of the process of taking the emergency stimulus out of the financial system and Wednesday’s FOMC meeting contained recommendations to start raising the discount rate as soon as possible. However, the difference between fed funds and the discount rate is only increasing to 0.5% from an average of 1% before the crisis. This move is really a "marketing" exercise than a real shift in policy. It is also a way to make banks a bit less comfortable (this plays in Obama's hands).

If TIPS are a good indicator of forthcoming inflation (which is really debatable), there is nothing to worry short/medium term. In any case the economic recovery is pointing towards a slow and bumpy one and wages are still in a deflationary environment with food and energy prices contained: without wage inflation and /or energy/commodities inflation, there will be no inflation near term (longer term we will get it due to all the money created worldwide). CPI number for January came at 0.2% today and -0.1% for core CPI (i.e. less food, energy and commodities), and 2.4 over the past 12 months (unadjusted) mainly due to energy prices hike.


I agree with David Rosenberg when he comments today:
So, it would stand to reason that the real test for the markets is going to come not from the discount rate, but by what happens when the Fed begins to shrink its balance sheet — particularly the ramifications for mortgage rates.
Last word: policy makers are prone to mistakes; I hope that my analysis of the stance taken by the FED is right, otherwise run for cover!

Source:

Bureau of Labor Statistics: Consumer Price Index Summary
http://www.bls.gov/news.release/cpi.nr0.htm

Gluskin Sheff: Breakfast Lite with Dave
http://www.gluskinsheff.com

11 January 2010

US unemployment: a few must see charts

Friday, I commented on non-farm payrolls weak numbers. Today, I am providing several charts from various sources that put these in perspective together with additional comments.


1. Employment and the 2000s: the lost decade

the number of jobs at the end of a decade has been anywhere from 20% to 38% greater than 10 years prior. This sub-par job growth is particularly noteworthy due to the fact that the US population has increased by 10% in addition to a significant increase in global wealth during the same time frame.

2. The unemployment situation in the current economic recession compares very badly with past one since WW II

This recession is the worst recession since WWII in percentage terms, and 2nd worst in terms of the unemployment rate (only early '80s recession with a peak of 10.8 percent was worse). We are lower as the 1948 recession but will recover like the 2001 recession i.e. very lengthy recovery.


3. Monthly Changes in Non Farm Payroll, 2004-09

This graph jut shows the gross figures. It is evident that the pace of job shedding is abating, but does not point towards a fast recovery in the employment situation.


4. The percent of those employed 27 weeks and over 27 weeks and over is at record high since WW II at 40%, almost twice the previous peak
Unemployed are having more difficulties to find a job. It is important for this number to decrease since then next step is for unemployed to no longer looking for a job.


5. The employment rate is now at the lowest since August 1983 at 58.2%

The decline has been particularly sharp.The US finished the decade at 130.9 million, practically unchanged from the start of the decade. Meanwhile, the total pool of available labour rose from 146 million to 159 million. Therefore we have 13 million more people competing for the same number of job than in 2000.


6. Temp help is improving

This is a positive signal since temporary jobs is a leading indicator on the unemployment situation. December was the 5th positive number in a row.


No doubt that we are seeing modestly positive growth in the economy and that the pace of job declines is moderating. This however has been the result of an unprecedented public sector intervention. The private sector is still idle despite the magnitude of a fiscal and monetary stimulus of of historical proportion.

The leaves me worried about the macro-economic outlook since the extraordinary measures taken in 2008-2009 cannot be repeated if the private sector does not roll again.

Source:

Chart of the Day
http://www.chartoftheday.com/20100108.htm?T

The New York Times: The Labor Picture in December
http://www.nytimes.com/interactive/2010/01/08/business/economy/0108-jobs-graphic.html

Calculated Risk: Unemployment Report
http://www.calculatedriskblog.com/2010/01/employment-report-85k-jobs-lost-10.html

Bruce Steinberg: Employment Report
http://www.brucesteinberg.net/Monthly_Employment_Situation.htm

Gluskin Sheff
https://ems.gluskinsheff.net/Articles/Snack_with_Dave_010810.pdf

08 January 2010

Poor US unemployment numbers

Change in nonfarm payroll came in worse than expected at -85,000 jobs vs. a consensus of a flat number (range +40.000/-50.000). Revisions showed payrolls increased the prior month for the first time in almost two years at +4.000 and decrease 127,000 in October. Both the number of unemployed persons, at 15.3 million, and the unemployment rate, at 10%, remained unchanged.

Looking at in more details, the numbers are rather bad:
  • Long term unemployed (those jobless for 27 weeks and over) continues to trend up at 6.1 million
  • Involuntary part-time workers were about unchanged at 9.2 million
  • Workers marginally attached to the labor force (want to work and are available for work but did not seek a job for at least 4 weeks) dramatically rose to 2.5 million (+578,000 over December last year)
  • Among these 2.5 million people, workers discouraged to seek a job increased by 642,000 compared to last year, for a total of 929,000
  • The civilian labor force participation rate fell to 64.6 percent in December. The employment-population ratio declined to 58.2 percent
If we add unemployed persons to workers marginally attached to the labor force, we reach an unemployment number close to 12% I we add the involuntary part-time workers, we are at 17.5% (100% ratio) or 14.5% (50% ratio).

This is on the back of December retail sales that look better than anticipated (+2.8% compared to a year ago according to ISCS sales index). With no improvement in the jobless numbers during the 3-6 coming months, having a negative effect on 1) would be consumers sentiment and 2) disposable income, there is a real risk that annualized growth recedes in 2010.

Source:

Bureau of Labor Statistics: Employment Situation Summary
http://www.bls.gov/news.release/empsit.nr0.htm

Bloomberg: Payrolls in U.S. Drop 85,000; Unemployment at 10
http://www.bloomberg.com/apps/news?pid=20601087&sid=aet6GtG2Ip_I&pos=1

Yahoo!: December retail sales show signs of life
http://news.yahoo.com/s/ap/20100107/ap_on_bi_go_ec_fi/us_retail_sales

29 December 2009

US housing market: still mixed signals

According to data released by the US Census Bureau on 23rd December, New home sales dropped by 11.3 per cent in November to an adjusted annual rate of 355,000. That was the lowest level in seven months. The good number for existing home sales last month seem to have cannibalized new home sales, as well as the tax break extension into next year announced by the Obama Administration.

The Case-Shiller 20 index published by Standard & Poor's today shows that home prices were flat and failed to keep pace with gains so far in 2009. The figures are not seasonally adjusted (+0.4% seasonally adjusted – the fifth straight improvement). In the past year, prices are down 7.3% in the 20 cities.

These numbers are not showing the beginning of a double dip in the housing market as yet. I will, however watch them very carefully in the coming month.


Source:

U.S. Census Bureau: New Residential Sales in November 2009
http://www.census.gov/const/www/newressalesindex.html

Financial Times: Sales of new US homes plunge unexpectedly
http://www.ft.com/cms/s/0/cdad284a-efce-11de-833d-00144feab49a.html?nclick_check=1

Standard & Poor’s: S&P/Case-Shiller Home Price Indices - October 2009

http://www.standardandpoors.com/indices/sp-case-shiller-home-price-indices/en/us/?indexId=spusa-cashpidff--p-us----type&blobwhere=1245200590760&blobheadervalue3=abinary%3B+charset%3DUTF-8&blobnocache=true

The New York Times: Slight Rise in Home Prices Masks Signs of Weakness
http://www.nytimes.com/2009/12/30/business/economy/30econ.html?_r=1&ref=business

28 December 2009

How much money did the US Government commit during the financial crisis to date?

Here is a diagram that summarizes the current state of the US commitment to avail the current financial crisis: $7.8 trillion and counting...


Source:

The Washington Post
http://www.washingtonpost.com/wp-dyn/content/graphic/2009/02/11/GR2009021101150.html

10 November 2009

A virtual interview with the WSJ and the FT - Part 3

FT: There is a debate about whether we are in a deflationary or inflationary environment: what are your views on this?

M&B
:My answer is yes to both. It looks contradictory but it is not. It depends of the time frame you choose. Let me explain. Short term we are in a deflationary environment for three main reasons:
  1. Banks are deflating their balance sheets and rebuilding their equity leading to less credit available that is definitely deflationary. It is more profitable and less risky to invest in Treasuries instead of lending to businesses and consumers with a financing cost near zero.
  2. Unemployment is above 10% in the US (add 10% more for underemployed and unemployed so discouraged they are not even looking for jobs), and rising. Therefore there is no pressure on wages (to the contrary) and there is no example of a sustained inflation period without wage inflation.
  3. There have been a massive wealth destruction (housing, bear markets) that not only left many in an extremely difficult financial situation but also resulted in a real psychological shock for many more, the pensioner or soon to be retired not being the least. They have to rebuild their savings and regain confidence; it will take time. This will be detrimental to consumption.
If short term I do not see any inflation threat, longer term I do.

  1. The FED and the likes will do everything they can to avoid a deflationary spiral. Money will continue flowing. It is however not flowing to the real economy (at least in the Western world) but to risky (equities) and non-risky assets (Treasuries/fixed income). There is an apparent contradiction here, since the surge in equity markets imply a V shape recovery whilst bonds imply a U shape recovery. I will come back on this later.
  2. The long term rise of developing economies will again spur demand for commodities and energy. The pause we have witnessed with the current crisis is only temporary. In the meantime many exploration projects have been postponed or canceled due to diminishing demand and a move away from riskiest assets; due to the time frame to develop mines and wells to bring them to production (a couple of years), we will see a new rise in commodities that will dwarf the 2006-2008 one.
    This may even go beyond: China has taken advantage of the crisis to use its financial might to secure reserves all around the world and are better placed than the West (and Europe in particular): the access to commodities may add to price surge.
  3. The wage deflation (stricto sensu or via high unemployment) cannot carry for too long without having long term destructive effects on the economy: consumers need purchase power to consume.
  4. Inflation is the politically less painful way to pay down ballooning public debt.
Medium to long term money creation coupled to growth in the developing world will lead to inflation (I do not expect hyperinflation however). This will lead mainstream investors to add fund to hard assets. Before this comes watch the mother of all bubbles to deflate: fixed income instruments.

Going back to the apparent contradiction between equity and bond markets, I refer to an interesting paper written by PIMCO, the world largest fixed income manager. Two extracts summarize it:
Thus, while rich risk asset prices can certainly be viewed as a consensus expectation for a strong recovery, such lofty valuations can also be viewed as a consensus expectation about the Fed's commitment to erring on the side of being too late, rather than too early, in starting a Fed funds tightening cycle. Indeed, one could actually be agnostic, even antagonistic, about a big-V recovery and still be favorably disposed to risk assets, in the short run. Historically, what pounds risk asset prices is either a recession or unexpected Fed tightening; or worse, both. Right now, it is hard to get wrapped around the axle about recession, since we've just had one, which might not even be over.
In turn, a bull flattening bias of the Treasury curve, with longer-dated rates falling toward the near-zero Fed policy rate, can be viewed as a consensus view that the level of the output/unemployment gap plumbed during the recession is so great that disinflationary forces in goods and services prices, and perhaps even more important, wages, will be in train, even if growth surprises on the upside. Accordingly, Treasury players, like their equity brethren, need not fear the Fed, as there is no economic rationale for an early turn to a tightening process.
I totally subscribe t0 their conclusion (emphasis mine):
Simply put, big-V'ers should be wary of what they wish for. U'ers, meanwhile, must be mindful of just how bubbly risk asset valuations can get, as long as non-big-V data unfold, keeping the Fed friendly. But that's no reason, in our view, to chase risk assets from currently lofty valuations. To the contrary, the time has come to begin paring exposure to risk assets, and if their prices continue to rise, paring at an accelerated pace.

Sources:

Federal Reserve Bank of St Louis
http://research.stlouisfed.org/fred2/graph/?chart_type=line&s[1][id]=BUSLOANS&s[1][range]=5yrs

PIMCO
The Uncomfortable Dance Between V’ers and U’ers
http://europe.pimco.com/LeftNav/Featured+Market+Commentary/FF/2009/PIMCO+Global+Central+Bank+Focus+Paul+McCulley+The+Uncomfortable+Dance+Between+Vers+and+Uers+11-09.htm

03 November 2009

A virtual interview with the WSJ and the FT - Part 2

FT: From early April to early July you saw the glass half full, and have seen it half empty since against improving economic indicators. Could you explain us why?

M&B: My view was that the sentiment was so negative and central banks providing so much money at near no cost that markets could only improved. Since the bottom of equity markets in March (China and Brazil excluded: they bottomed end October 2008, the MSCI emerging markets index in November) to 27Th October, the DJ is 50% up, S&P +57%, NASDAQ +70%, FTSE +48%, DAX +53%, NIKKEI +43%, SENSEX + 95%, SHANGHAI +75%, BOVESPA +70% and the MSCI emerging markets +102%. In the meantime, the economy has not really improved, whilst no longer in a nosedive. The improvement noticed during Q2 and Q3, was mainly due to Government money (car industry and the financial sector in the US and Europe, tax credit for first-time owners for residential real estate in the US, etc.) and inventory rebuilding after having been crushed late 2008 and early 2009. However, if unemployment does not improve in the coming months (which I doubt), I believe that retail sales will be flat or nearly flat towards the end of the year (I do not see how sales could improved when consumers are fearing for their jobs and need to rebuild their balance sheets). In my opinion, this could lead to a second wave of adjustments by companies or at least delay investments and hiring. Interesting enough, last week, Goldman Sachs cut its US GDP prevision from 3% to 2.7%.


I have also been worried about the commercial real estate situation where prices dropped 40% between August 2009 (latest data available) and October 2007 (peak of the cycle) – I remember well what happened in the early 1990’s. The outstanding face value of US commercial real estate loans amounts to USD 2-3.5 trillion depending on sources, including USD 270-275 billion due next year and over USD 1 trillion by 2015. Banks own 45% of commercial real estate loans, compared to only 21% of single-family loans and U.S. Office Vacancies Reach Five-Year High of 16.5%. In September, the FED noticed that banks were slow to take losses on their commercial real-estate loans.

Undoubtedly, banks will have additional large losses coming from this sector and the rest of the economy will be impacted, whilst probably not to the same extent as the residential real estate that had a huge psychological effect in additional to the financial one: this may stall any recovery in 2010-2011. Banks will need either to further reduce their balance sheet to be in adequacy with prudential ratios and/or raise new capital. Just look at all the cash call that banks in Europe and the US have done over the past few months or are attempting to do, besides selling assets.

I will not come back to changes that occurred on rule FSA 115 regarding fair value accounting (and my opposition to it since it increased opacity): whilst giving some breathing space for banks, it did not solve the problem and may compound it in the future.

To summarize: too far too fast. Markets have been sustained by liquidity that has not been channeled to the real economy (i.e. most of it!). I am not however in the camp of the gloom and doom for the world economy, whilst I am rather negative on the Western world economy.


Sources:

Bloomberg
U.S. Office Vacancies Reach Five-Year High of 16.5%
http://www.bloomberg.com/apps/news?pid=20601206&sid=aEfOnZ74Jis0

Wall Street Journal
Local Banks Face Big Losses
http://online.wsj.com/article/SB124269114847832587.html

Foresight Analytics
Commercial Mortgage Outlook: Growing Pains in Mortgage Maturities
http://www.foresightanalytics.com/stu_mtgmat.php

Congressional Oversight Panel
August oversight report: The continuing risk of troubled assets
http://cop.senate.gov/documents/cop-081109-report.pdf

MIT
MIT Center for Real Estate
http://web.mit.edu/cre/research/credl/rca.html