Showing posts with label economic indicators. Show all posts

28 August 2012

Current account surplus is a key determinant to bonds market turnaround: Italy’s case


I am reproducing in extenso a market view published bay Horseman Capital which deals with the importance of current account in assessing the ability of a country to return to good fortune, i.e. when the bond market is turning around. In a previous review published in October 2011, Rusell Clark made a good case that returning to a current account surplus is key to the turning point in bond markets.

This espouses my views about France being the real sick man of Europe as exemplified by the graphs below (and see http://marketsandbeyond.blogspot.com/2011/10/who-should-be-single-rated-italy-or.html):
Let’s now read what Russell Clark has to tell us about current accounts, Italy and the bond market.
“Sovereign Debt – Italy
In my last note on Sovereign debt – sent out in October 2011 – I noted that in all the debt crises that I have looked at, the turning point occurs when the troubled country can turn its current account deficit into surplus. I noted that of the distressed peripheral countries in Europe only Ireland had achieved current account surplus, and hence we were buyers of Irish bonds.
Since then Irish bonds have recovered most of their losses of 2011, and the Irish government has been able to return to the bond market. This is during a period of sustained instability in the far bigger bond markets of Spain and Italy.
Italy
Italy has one of the biggest bond markets in the world, and financial commentators quite rightly point out that its size means that it would be difficult if not impossible to implement the same programs that have been used by the European authorities in Portugal, Ireland and Greece. Hence, in my view the future of the Italian bond market is probably a key determinant of the survival of the Euro in its current form.
Like the other troubled nations of Europe, Italy has been running a current account deficit for a prolonged period of time. There have been recent signs of improvement, but not enough to move Italy to a current account surplus. The Economist estimates that Italy will run a 2.4% current account deficit for 2012.
However, beneath the slowly improving current account numbers, Italy’s bilateral trade numbers are showing signs of big improvements. Italy has shown a dramatic improvement in its trade deficit with China, the EU and the US.
If Italy has improved the trade positions with three biggest economic regions of the world, why have we not seen better improvement in the Italian current account? The answer is apparent when we look at the break down of Italian trade by category. As can be seen below, Italy has improved its manufacturing trade balance significantly, but all the gains in this area have been lost due to increasing commodity (mainly energy) trade deficit.
Should we see lower energy costs, I believe we would see a significant fall in the Italian current account, potentially pushing Italy to a current account surplus. For investors looking to play lower commodity prices via a long position in fixed income, Italian bonds look attractive in my view.
Almost all of Italy’s energy needs are priced off the Brent oil price. In 2008, all energy sources were comparably priced, but since then we have seen large divergences, which have put Italy at a disadvantage. Should we see a convergence in energy prices, Italy should be a relative winner, and Italian bonds should also prove to be relative winners.”
Source:
Horseman Capital: Russell Clark – Market Views August 2012
www.horsemancapital.com
Trading Economics
http://www.tradingeconomics.com

Markets & Beyond: Who should be single A rated: Italy or France?

http://marketsandbeyond.blogspot.com/2011/10/who-should-be-single-rated-italy-or.html


09 October 2011

Who should be single A rated: Italy or France?


I am amazed that France rating has not been downgraded as yet: it does not deserve a AAA by a long margin.

First, have a look at current rating for European countries (please note that since this table was published, Moody’s downgraded Italy 3 notch to A2 from Aa2, i.e. the same as Poland or Cyprus). This downgrade is probably justified in itself, but I am questioning how France can retain the top rating.
From data published by the OECD in May and the IMF in September, France is in a worse shape than Italy according to many indicators.

1. Debt/GDP

If the debt/GDP is the Achilles heel to Italy, its growth is nowhere comparable to France’s which is catching up quickly: +6% for Italy for the period 2000-2012 and +52% for France.
2. Real DGP growth

France is much better off with GDP growth twice the pace of Italy during 2000-2012 at 1.5%. French growth is however mainly due to domestic consumption spurred by the state welfare that France can no longer afford.
3. General Government Financial Balances

The French welfare state largess translated into higher budget deficits whatever the Government (France hasn’t had any balanced budget since 1978): the Maastricht 3% deficit ceiling was respected only 4 times since 2000, France doing much worse than the eurozone average since 2008 (-5.9% vs. -4.6%); - Italy fared better with -4.1%.
Analyzing further the budget, the situation looks even much worse for France: its primary budget balance has been negative for 10 years whilst Italy had always been positive (note that Italy’s primary budget is even much better than Germany). The IMF does not expect France’s primary budget to become positive before 2015.
4. Trade balance (goods & services)

This indicator is not helping out France’s precarious position, to the contrary. Since 2005 France has experienced increasing trade deficits, together with Italy but with an incomparable magnitude: USD 489 billion cumulated, 2.3 times more than Italy; Germany in the meantime accumulated a USD 1550 billion surplus. In percentage of GDP the analysis is the same.

True France enjoys a net investment income whilst Italy is negative, which translates into a comparably better current account for France.
5. Unemployment rate

Unemployment is another indicator where France is not comparing well with Italy, underperforming since 2003.
Conclusion

France does not deserve the top rating with the three main rating agencies (by the way, when European politicians accuse these agencies of an American plot against Europe, beyond being a “scapegoating” affirmation, they should remember that Fitch belongs to a French company, Fimalat).
According to the indicators presented, France should hardly be better rated than Italy.

Add guarantees to be given by France for Dexia’s failure (where France should bear most of the burden since most of the problem arises from Dexia CLF - the French part of the group with 259 x leverage!) and I do not see how and why France will keep its AAA. Belgium is under watch for possible downgrade following Dexia’s bankruptcy. It is also quite “funny” to watch France arm twisting Belgium to bear most of the burden in order to keep its AAA (that it will loose anyway): how guarantees for the EUR 95 billion impaired portfolio will be shared (EUR 66 billion in Dexia CLF balance sheet)…

The “funniest” of all is that Dexia CLF is going back to CDC (the French state owned financing vehicule) where it originally came from under the name of CAECL. From privatization to nationalization, 20 year of incompetent board of directors that let an incompetent management expand all around the world into risky businesses without the means (read capital) of their ambitions.

Please note that I do not blame the new management that arrived after the 2008 rescue since Dexia was doomed: there was not much they could do, and they probably did what they could with the legacy they got.

Source:

WSJ: S&P Cuts Italy's Sovereign-Debt Rating


http://online.wsj.com/article/SB10001424053111904106704576581301721363640.html

IMF: World Economic and Financial Surveys

http://www.imf.org/external/pubs/ft/fm/2011/02/pdf/fm1102.pdf


© Markets & Beyond
 
OECD: OECD Economic Outlook No. 89


http://www.oecd.org/document/61/0,3746,en_2649_34573_2483901_1_1_1_1,00&&en-USS_01DBC.html


Markets & Beyond: Dexia in 2 slides and a few words

http://marketsandbeyond.blogspot.com/2011/10/dexia-in-2-slides-and-few-words.html

31 August 2010

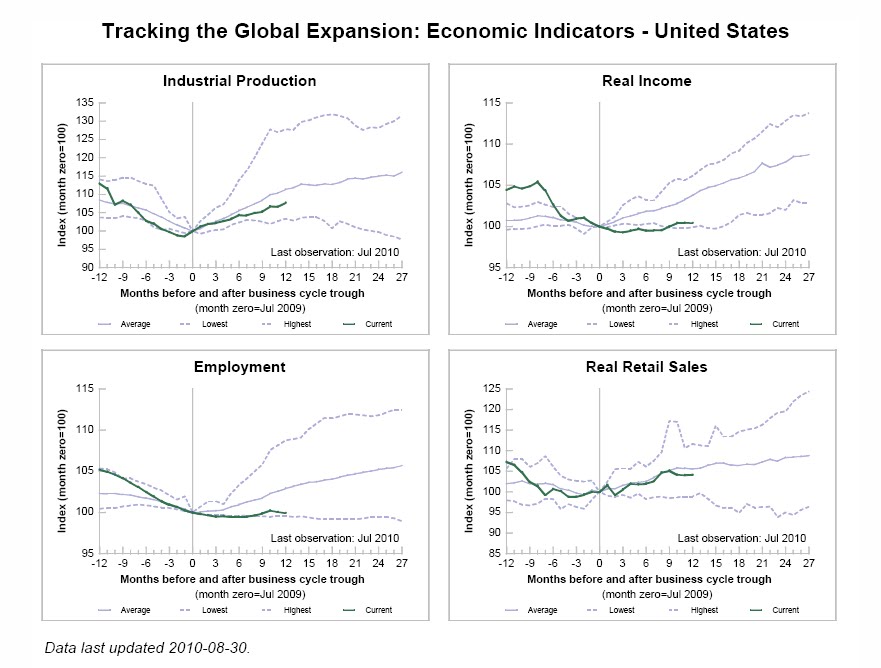
Summary US economic indicators

I found the tables below good summaries of US economic indicators.
As well publicized, including in this blog, the weakest point is the employment situation and consumption its corollary; for the rest the situation is not as disastrous as often related in medias, in particular on the investment front. All these graphs and indicators are posted without any further comment.


Source:

Federal Reserve Bank of St. Louis: Tracking the Global Economy - United States

http://research.stlouisfed.org/economy/us/index.html

U.S. Department of the Treasury: Economic Statistics - Quarterly Data Update

http://service.govdelivery.com/service/view.html?code=USTREAS_6

23 March 2010

Economy and equity markets: are they disconnected?

saSince July 2009 I have been ambivalent with equity markets after their strong recovery from March low and continued weak economic data. The magnificent 7 indicators are all favorable and therefore tell us that there is nothing to panic about equity markets. But is this disconnected from the economic reality? So, let’s review a number of economic indicators. More than the numbers themselves, I will be looking at trends. In this analysis, I will neither review the situation of the financial sector nor the housing sector.
1. GDP breakdown
The second estimate of the fourth-quarter increase in real GDP is 0.2% higher than the advance estimate at 5.9% annualized, primarily reflected upward revisions to private inventory investment, exports and nonresidential fixed investment that were partly offset by an upward revision to imports and downward revisions to personal consumption expenditures and to state and local government spending.
The trend is definitely improving. The next 2 quarters will tell us whether we may get into a second dip recession. Today, I tend to give the GDP the benefit of the doubt.
The Conference Board Leading Economic Index increased 0.1% in February (+0.3% in January and +1.2% in December) pointing to a slow recovery, but a recovery nonetheless.
Ken Goldstein, Economist at The Conference Board: "The indicators point to a slow recovery this summer. Going forward, the big question remains the strength of demand. Without increased consumer demand, job growth will likely be minimal over the next few months."
2. Consumption
Personal disposable income has grown for 5 month in a row until it decreased in January due to an increase in federal non-withheld income taxes according to the Bureau of Economic Analysis. At the same time, the personal consumption expenditures went up for the 9th consecutive month in January (+ $52.4 billion). The personal saving rate decreased to 3.3% from 4.2% in December, but is now in solid favorable territory, even if I would like to eventually see it in the 7-8% region.
The trend is positive. In my opinion, pay checks given by the Bush and Obama administrations were used to repair households’ balance sheets during H1 2009, and now we are witnessing a non-subsidized consumption growth.
Household debt service payments and household financial obligations as a percent of disposable personal income have also decreased from 13.92% and 18.87% in Q1 2008 to 12.60% and 17.51% in Q4 2009 respectively.
All this translated into an improving picture for retail sales.
3. Unemployment
Unemployment seems to have stabilized with an unemployment rate of 9.7% in February and 14.9 million unemployed; the number increases to 16.2% and 24.9 million unemployed if we add part-time workers for economic reasons and discouraged workers, but slightly off the high reached a coupe of months ago. However, the number of discouraged workers continues to increase unabated to 1.2 million people (+65% compared to February 2009 and + 13% compared to January 2010) .
The employment situation, according to the establishment data, confirms this stabilization. Total non-farm employment went down 36,000 in February vs. -26,000 in January, -726,000 in February 2009 and -109,000 in December. Weekly hours worked also point toward a stabilization.
The diffusion index for the total private sector dramatically improved to 48.0 in February vs. 44.2 in January, 39.6 in December and 17.1 in February 2009 (50 percent indicates an equal balance between industries with increasing and decreasing employment). The diffusion index for manufacturing jumped to 54.9 in February vs. 40.9 a month earlier.

4. Banks’ lending
In February, banks continued to shrink commercial loans for the 16th month in a row, shedding an additional $17 billion; total commercial loans outstanding are back to the summer 2007 and $345 billion below the peak reached in October 2008 ($1,645.6 billion).
Whilst this is negative for growth as a whole since less credit is available, I take it as a favorable element in what was an economy built on over-indebtedness steroids, particularly at the household level, and the system has to be purged.

In addition, the rate of decline seems to be arriving at or near a trough.
5. Net export of goods and services
The balance of net export of goods and services dramatically improved, whilst higher again for the last two quarters, to represent a $449 billion deficit. This suggests that the US trade deficit will have a long way to really get any closer to being balance.
As soon as the economy will improve on a sustainable basis, energy and commodities prices will forge ahead and will add more weigh on the US trade balance. Any oil alternative like gas or shale gas, will take some time to gap the national output/consumption imbalance, but worth watching since it could change the ball game.
Conclusion
Equity markets have anticipated the economic recovery which is in its infancy. The important indicators are at worse stabilizing. Markets paused in July and again in January/February to go back to their previous high and extend to new post crisis highs.
As of today, market patterns are justified by economic data. However, on a simple valuation based on Shiller’s cyclically adjusted PER, the S&P 500 is becoming expensive at 21.3 x earnings on March 18 vs. 13.3 x in April 2009 and an average of 16.4 x. On a simple PER basis, the S&P 500 is trading at the top of its mid 30s - mid 90s range but well below its mid 90s – 2008 exuberance.
I conclude that equity markets are not disconnected from the real economy and there no reason, under the current circumstances, to fear a market collapse. The S&P is however no longer cheap and, despite a good earning season, I would continue to selectively buy on weakness quality stocks having displayed their ability to pay dividends. I would favor energy (oil in particular), technology and consumer companies with worldwide brands (P&G, Nestlé, Unilever, J&J for example) as well as “progressing” markets (terminology that I prefer to emerging) and stay wary of bank’s stock at least in the "regressing" world (i.e. developed).
Monetary policy will remain accommodative until the real estate market has fully recovered and don't forget, “never fight the FED”. As my friend, Jacques-Henri Gaulard, Managing Partner of Autonomous Research – a top notch independent research firm specializing on the financial sector -, says about interest rates : "we have moved from L4L to L4E – Low for Longer to Low for Ever…"

Sources:

Bureau of Economic Analysis: National Economic Accounts
http://www.bea.gov/newsreleases/national/gdp/2010/txt/gdp4q09_2nd.txt

The Conference Board: Global Business Cycle Indicators
http://www.conference-board.org/pdf_free/economics/bci/birdairc2.pdf

Bureau of Labor Statistics: Employment Situation
http://www.bls.gov/news.release/empsit.toc.htm

Federal Reserve Bank of St Louis: Economic Research
http://www.research.stlouisfed.org/

Yale Department of Economics: Robert Shiller Online data
http://www.econ.yale.edu/~shiller/data.htm
FullerMoney: S&P 500 Graph
http://www.fullermoney.com

Markets & Beyond: The Magnificent 7 and Equity Markets
http://marketsandbeyond.blogspot.com/2010/03/magnificient-7-and-equity-markets.html
Autonomous Research
http://www.autonomous-research.com/x/default.html

13 August 2009

"Une hirondelle ne fait pas le printemps"

So GDP in Europe contracted less than the consensus at 0.1% vs. 0.5% during Q2 2009? Germany and France showed positive numbers at +0.3% each? So, the recession is over?
  1. Economists have proven so many time that they are wrong, that my confidence in consensus numbers and forecasts is at an extremely low level. Numbers are better than the consensus, so what? It just shows that economists are bad at forecasting.
  2. As Barry Ritholtz recalls on his blog, The Big Picture, in 2001 Q2 was also positive whilst Q1 and Q3 were negative; a positive quarter does not imply the end of the recession: "Une hirondelle ne fait pas le printemps".
  3. French GDP +0.3%: yes. And according to Christine Lagarde, public sector investment had a strong impact, whilst exports contributed for 0.9% thanks to exports in the automotive sector to Germany and private sector investment for -1.8% (still very weak). Consumption stood at 0.3%, due to government trade-in schemes for old cars and falling prices, particularly among big retailers.
  4. German GDP +0.3% (see graph below) on exports and government help for new car purchases.


Is the financial crisis over? Yes (or at least most of it -watch however commercial real estate bad loans as well as credit card delinquencies for the coming quarters): OIS and TED spreads are back to normal, financing costs is next to zero, competition is slimmed down, bank profits are therefore up (even if profits from trading generally is volatile).

Is the economic recession abating? Yes, but we are still not out of the woods as yet, and claiming that the recession is over, is over the top. However, my sense is that we still are several months away, say 6-12 months. Don't forget: "Never fight the FED".

Markets are rallying on the news, after yesterday's drop. I am still of the view that a consolidation is overdue and that markets could loose anywhere between 10% and 15% until early Q4 2009 to start rallying again late Q4 for the next leg. Then watch commodities going through the roof in 2010-2011.

Sources:

Bloomberg: Euro-Area Economy Contracted 0.1% in Second Quarter
http://www.bloomberg.com/apps/news?pid=20601087&sid=aAL7VZFlPRow

XE: French Q2 GDP rises 0.3 percent-minister
http://www.xe.com/news/2009-08-13%2002:54:00.0/609921.htm?c=1&t=

Eurostat: Newsrelease
http://epp.eurostat.ec.europa.eu/cache/ITY_PUBLIC/2-13082009-AP/EN/2-13082009-AP-EN.PDF

Finfacts: Business News Centre
http://www.finfacts.ie/irishfinancenews/article_1017398.shtml

30 June 2009

From green shoot to brown shoot?

Tuesday's numbers in the US were nothing to rejoice:

The biggest downward surprise was the slide in the Conference Board consumer confidence measure to 49.3 in June from 54.9 in May and well short of the 55.3 consensus. The decline was spread out between both "expectations" (to 65.5 from 71.5), which does a decent job in predicting the near-term trend in consumer spending, and the "present situation" (to 24.8 from 29.7). Confidence is still well above the historic 25.3 low posted in February but is still very much consistent with an economy knee-deep in recession. For example, when the economy was moving out of recession in November 2001, the index was 84.9; at the end of the 1991 recession it was 81.1; when the 1982 recession came to a halt, the confidence survey was sitting at 57.4. Never before has a recession ended with confidence as low as it is today.

Inflation expectations jumped 3 tenths in the month to 5.9 percent fed by a roughly 5 percent rise in pump prices during the month. There's no indication that concern over monetary inflation is at play in inflation expectations.

The gap between this survey and the University of Michigan sentiment index, which ticked up to 70.8 from 68.7, is that the former has more of an "employment" orientation to it — and the labour market still looks very soft. The "jobs hard to get" series went from 43.9 to 44.8; and the "jobs are plentiful" component slumped to 4.5 from 5.8. The labour market gap (the spread between these two series) rose to 40.3 from 38.1 in May, which portends yet another month of rising unemployment when Thursday's data roll out.

In terms of spending intentions, housing is still getting very little traction as home buying plans edged down to 2.7% from 2.8%; plans to buy a major appliance slipped to 26.5% from 29.2%; and even with all the excitement over 'cash for clunkers', auto purchase intentions rolled over big-time to 4.6% from 5.7% in May in what was the second lowest print of the year (and suggests that the expected 10 million unit auto sales for June is a blip in an otherwise fundamental downtrend in consumer discretionary spending).

Case-Shiller's 20-index fell 0.6 percent in April, down from a long run of minus 2 percent readings, while the year-on-year rate improved to minus 18.1 percent, thus moving in the right direction. Whilst the second derivative is improving, don't forget that there is still at least 10 months supply of unsold inventory in both the new and existing residential market. Let's see what data the 2-3 forthcoming months will produce.

Next data on the housing front will be Wednesday's MBA report. Also the important ISM manufacturing report will also be released Wednesday to see whether it confirms Tuesday's data.

Source:

Bloomberg: June 30, 2009
http://www.bloomberg.com/markets/ecalendar/index.html

Gluskin Sheff: June 30, 2009
Market and data musings - David A. Rosenberg
https://ems.gluskinsheff.net/Articles/Lunch_with_Dave_063009.pdf

07 May 2009

News of the day May 07

  • U.S. Initial Jobless Claims fall to three-month Low to 601,000 in the week ended May 2 (-34,000) confirming yesterday's ADP employment report; let's see the payroll report tomorrow.
  • U.S. Productivity Rises 0.8%; Labor Costs Gain 3.3%.
  • ECB cuts rate 0.25% to 1% and and said it would buy euro-denominated bonds (EUR 60 billion) as well as offer longer-term credit to banks. The BoE keeps rates at 0.5% but increased its bond-buying plan by £50 billion ($75.71 billion) to £125 billion.
  • GM posts $6bn loss on sales down 47% (!) during Q1 and a cash burn of $10.2 billion. This brings total losses since 2004 to $88 billion; one may wonder how it survived for so long... Anyway bankruptcy is getting closer by the day with an additional $2.6 billion of tax payer money needed for May.

06 May 2009

From fear to greed?

Today, publication of a stream of economic data, some bad, some not so bad:
  • The PMI in the euro-zone continued to contract in April but at a slower pace (41.1 vs 38.3). In the UK the PMI for services also contracted at a lower pace (48.7 vs 45.5). In both cases it was better than expected. Retailing and manufacturing are however getting worse whilst business expectations are back in positive territory (54.4).
  • House prices continued to fall in the UK (-17.7% in April from a year earlier)
  • The employment report from ADP shows that US job losses would have shrunk to 491,000 from the 600,000+ we have been used to over the last couple of months.Let's see on Friday whether the official numbers match these.
  • The Zillow U.S. home value report for 2009 Q1 shows they continued to slide for the ninth consecutive quarter, declining 14.2 percent from a year ago, and falling 21.8 percent since the market peak in 2006, but the pace is slowing down. Additionally, one-fifth (21.9%) of all homeowners in the United States is in negative equity, and one in five homes sold in the past 12 months was a foreclosure.
  • Leaked information on the United States government’s stress tests of 19 major financial companies, lead to depict the situation as not so bad: a handful of banks will need to raise capital ($33.9 billion for BoA, $5-10 billion for Citi, either via new equity, converting existing preferred share -including Government preferred stock- or asset sales) and investors shrugged off concerns about the results of the so-called stress tests.
  • The earnings season is coming to an end and was better than expected, particularly in the banking sector.
These numbers, like the ones of the earning season, are bad but not as bad as expected, hence the feel good sentiment for markets.

Psychologically, markets are moving from fear to greed. To me, it is an indication that they will correct in the coming weeks. This correction could be sharp, the economic, financial and social environment being still very unstable. Tomorrow's market reaction to details of banks stress-tests and Friday's non-farm payroll numbers will be interesting to follow and may trigger a correction if they are not up to expectations built during the past days and weeks.

Article of the day:

We can't subsidize the banks forever - Government has to show it can handle major insolvencies by Richardson and Roubini:
http://online.wsj.com/article/SB124147831175584985.html

28 April 2009

Market wrap-up April 28

Today's markets

Nikkei 225 8494-232.57 (-2.67%)
Hang Seng 14555-285.31 (-1.92%)
All Ordinaries 3672-18.30 (-0.50%)

FTSE 100 4096-70.61 (-1.69%)
CAC 40 3051-51.41 (-1.66%)
DAX 30 4607-87.86 (-1.87%)

Dow 8017-8.05 (-0.10%)
Nasdaq 1674-5.60 (-0.33%)
S&P 855-2.35 (-0.27%)

Light Crude (NYM)
49.92 (-0.22)
Natural Gas (NYM)
3.44 (+0.08)

Gold (CMX)
893.60


(-14.60)
Silver (CMX)
1,242.60


(-55.90)

Markets are unsettled by the swine flu epidemic and the renewed uncertainty about the health of the banking sector with rumors regarding the results of the stress test and the swap of TARP loans into equity for a number of US large banks (Bank of America and Citicorp are the most widely rumored).

News of the day