I do not intend to be comprehensive with tons of indicators
which are available: I will only focus on a few which, in my opinion, are
making THE difference.
1. The banking sector
Whilst US banks have largely cleaned up their balance sheet,
or more exactly dramatically reduce their leverage to around 15 x, and have
been able to return to markets to fund themselves at market price (the FED has
withdrawn its unconventional liquidity measures), the European banking system
remains under life support from the ECB in the turn of EUR1 trillion Long-Term Refinancing
Operations. The European banking system has a funding gap of EUR 1.3 billion, and
as the WSJ writes “… if European banks were funded the same way as U.S.
banks, they would have a deposit surplus of $3 trillion”.
This is why the US
banks are lending t the US
economy and European banks do not finance the EU economy whilst remaining too
leveraged at 30 x. To worsen the situation, banks are increasingly hoarding
money with the ECB: USD1.4 trillion as of 9 November.
2. Lending to the
economy
The US commercial and industrial loans from all commercial
banks is an indicator I follow on a regular basis and it proved to be a good
early indicator of the US economy turnaround. Velocity is however part of the
money creation and has dramatically fallen since the beginning of the financial
crisis.
Today, I am adding velocity to present a more precise
picture. Interesting enough velocity of MZM(1) * commercial &
industrial loans by all commercial banks turned up +/- 1 year ago, adding a
bullishness view on the US economy, despite the fact that MZM velocity is at 1.4
x, the lowest since 1959 (when it started to be reported). Banks are financing the US
economy.
(1) MZM = M2 less small-denomination time deposits
plus institutional money funds. Money Zero Maturity
3. Energy
One point largely occulted by commentators regarding the US fiscal and
trade deficits is the energy sector. If the US, and everything seem pointing in
this direction, becomes self sufficient within 10 years, this will be huge
boost to the trade balance and therefore the GDP growth.
The oil & gas 2011 trade deficit stood at $993 bn for a
GDP 15,321 bn or a negative growth of 6.5%; if one assumes that thanks to unconventional
oil & gas the US can reduce its energy trade deficit by 50% this would add
3% to GDP: this is a game changer and the fiscal cliff would be much easier to
climb.
The unconventional gas
industry will have far reaching effects including job creation and re-industrialization.
According to HIS, “the shale gas production supported 600,000 jobs in 2010, a
number that is projected to grow to nearly 870,000 by 2015”.
PWC mentions in a 2011 report that by 2025 shale gas will save
US
manufacturers USD11.6 billion a year in gas expenses and add 1 million workers.
Hence my positive stance on the US economy.
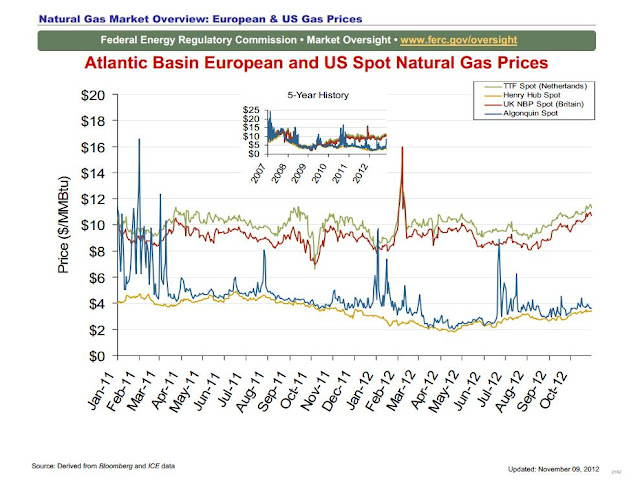
What will enhance competitiveness
of the US industry will have
the reverse effect in Europe which largely
ignores shale gas on the ground of ecological worries. This will represent
a competitive disadvantage to Europe not only in term of price but also independence,
since Europe largely relies on non-EU
supplies.
When enlarging the picture, the map shows that the US competitive advantage goes well beyond Europe:
other countries are paying 3 to 4 times the US price.
Finally, the competition between energy sources had a direct
impact on crude oil in the US. The gap between the Brent and WTI started to widen two years ago to reach a 20%
price advantage today, not petty money.
Source:
Federal Reserve Bank of St Louis: Economic Research
http://research.stlouisfed.org/
Federal Energy Regulatory Commission: Natural Gas Markets
http://www.ferc.gov/market-oversight/mkt-gas/overview.asp
Wall Street Journal: Why Europe’s
Banks Trail in Deleveraging Process
http://online.wsj.com/article/SB10001424052702303816504577303582094739676.html
Live Wall Street Journal: European Banks Still Hoarding
Money
http://live.wsj.com/video/european-banks-still-hoarding-money/798ED78D-6CA2-442D-A41B-54FA9CB860A9.html?mod=wsj_article_tboleft#!798ED78D-6CA2-442D-A41B-54FA9CB860A9
Penn State University:
The Economic Impacts of the Pennsylvania
Marcellus Shale Natural Gas Play: An Update
http://www.anga.us/media/41077/penn%20state%20marcellus%20study.pdf
HIS: The Economic and Employment Contributions of hale Gas in
the US
http://www.ihs.com/images/Shale_Gas_Economic_Impact_mar2012.pdf
PWC: Shale Gs – A renaissance in US manufacturing?
http://www.pwc.com/en_US/us/industrial-products/assets/pwc-shale-gas-us-manufacturing-renaissance.pdf


